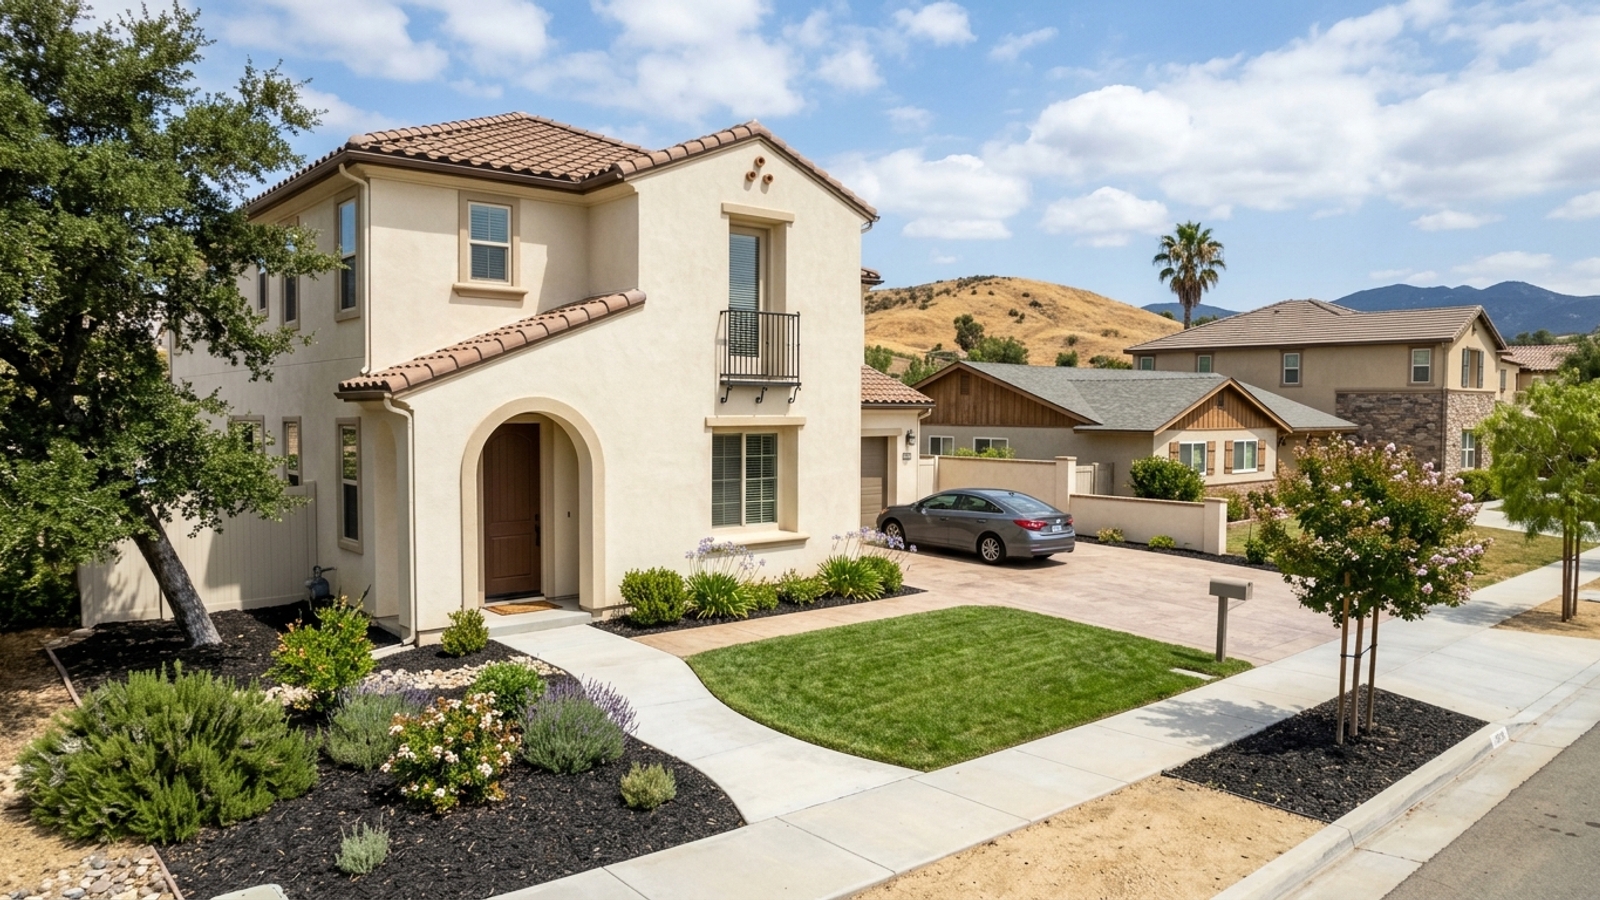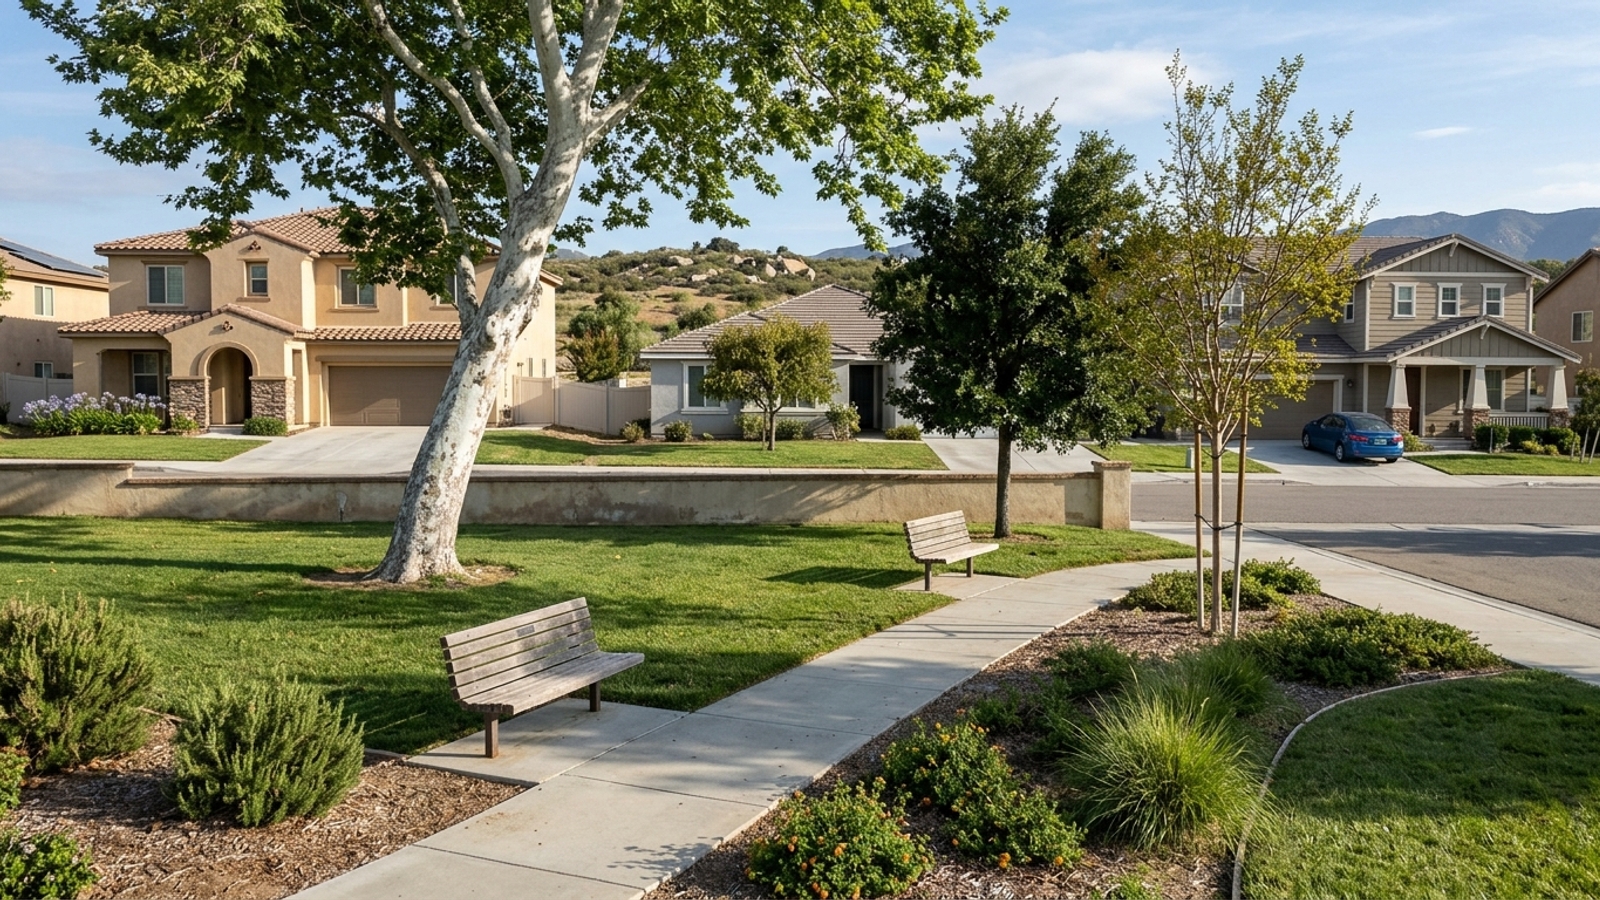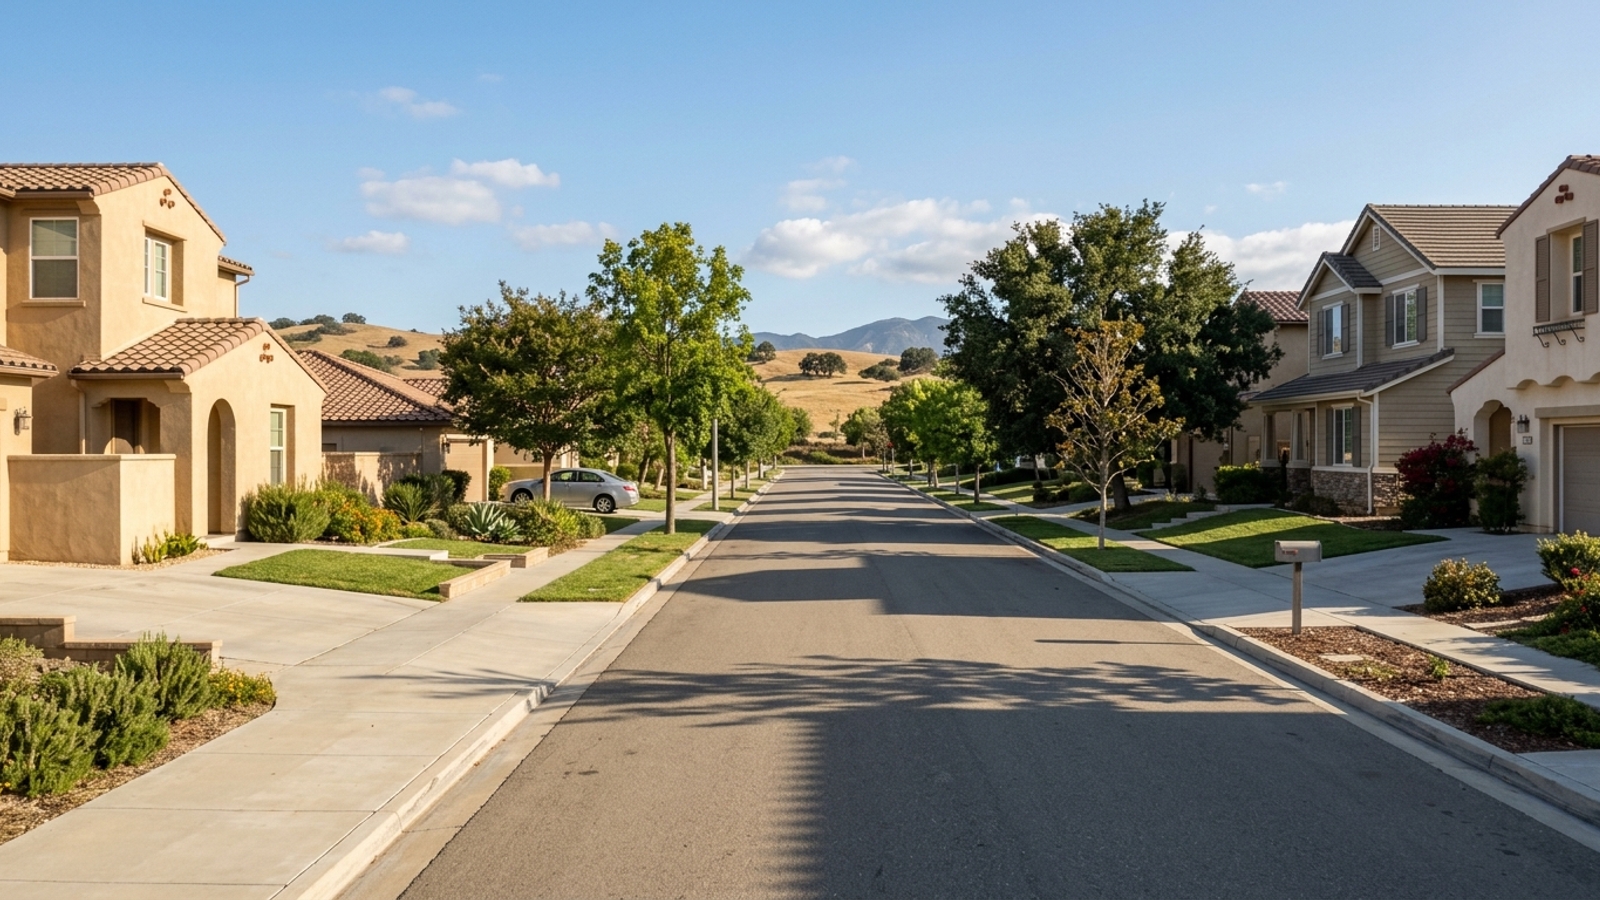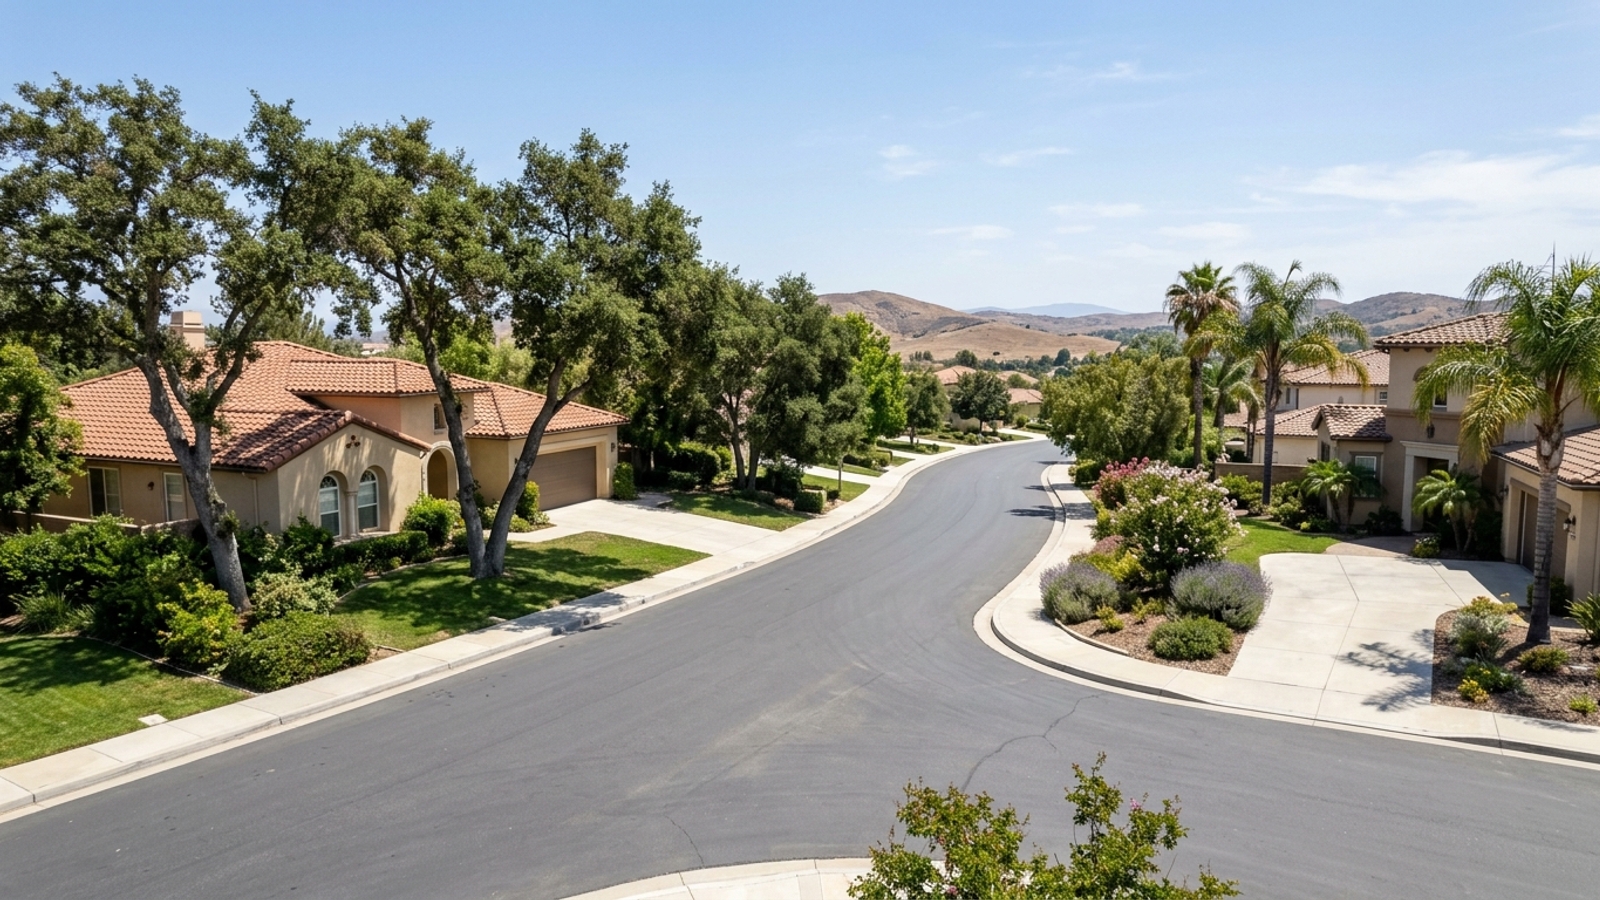
Buyers weighing the pros and cons of living in Temecula, CA are often drawn to the area for all the obvious reasons - Wine Country, outdoor recreation, a solid local economy. As of mid-2026, the market is moving: homes are selling in roughly 35 days, and the median sale price sits around $747,000.
One question I hear consistently from buyers relocating to Riverside County is about safety. It’s a fair thing to ask, and the answer isn’t just a gut feeling or a neighbor’s opinion. There’s actual data to look at - crime statistics, emergency services, environmental hazards - and I’d rather walk you through it honestly than hand you a cheerful non-answer.
Looking at the Crime Data for Temecula, CA
No single source owns the definitive number. Different reporting agencies use slightly varied methodologies, so the figures shift depending on where you look. That’s not a red flag - it’s just how crime data works.
Overall, Temecula sits close to or slightly below national crime averages. AreaVibes and Nextdoor both report the city’s overall crime rate running roughly 13.6% to 23% below the national average. That’s driven mostly by a low violent crime rate, though property crime runs a bit higher than you might expect.
Comparing Local Rates to State Averages
For context, California reported a violent crime rate of 481 per 100,000 residents in 2024 - a 5.3% decrease from 2023. The state’s property crime rate that same year sat at 2,084 per 100,000 residents, which was its lowest level since 1985.
Temecula tends to hold up well against those statewide benchmarks. NeighborhoodScout puts the city’s overall crime rate at about 18 crimes per 1,000 residents. That figure is higher than 64% of California’s cities and towns, but it remains lower than many similarly sized U.S. cities outside the state - so the comparison depends heavily on your reference point.
How Reporting Agencies Grade the Area
Most of the online platforms you’ll encounter - CrimeGrade, NeighborhoodScout, CrimeMapping - pull from the FBI Uniform Crime Reporting (UCR) program and local agency logs. Because city borders and zip codes don’t always line up cleanly, the same municipality can produce slightly different grades depending on which tool you use.
Use these platforms to read general trends, not to find a single verdict. Checking across multiple sites gives you a more balanced read than putting all your weight on one score.
Violent and Property Crime Statistics
Violent and property crime categories tell you a lot more than a single composite number. In Riverside County - and in Temecula specifically - property crime makes up the vast majority of what actually gets reported. Theft, vandalism, that category. Violent crime is a smaller piece of the picture.
Per-capita rates are the right metric to use here. Raw incident counts grow with population, so they’re less useful for understanding your actual statistical exposure.
Understanding the Rate per 1,000 Residents
The violent crime numbers vary by source. CrimeGrade puts Temecula’s violent crime rate at roughly 3.315 per 1,000 residents in a typical year. NeighborhoodScout estimates it closer to 2 per 1,000, which aligns with the national average and works out to about a 1-in-665 chance of victimization.
Property crime shows a similar spread. CrimeGrade reports 15.86 per 1,000 residents; NeighborhoodScout puts that figure slightly higher at about 17 per 1,000. Both sources indicate an above-average chance of property crime victimization compared to similarly sized U.S. communities - that’s the honest read.
Recent Shifts in Reported Offenses
Year-over-year fluctuations are normal. Economic conditions, population growth, and law enforcement staffing all move the needle. A single quarter’s data doesn’t tell you much; multi-year trends do.
Property crime remains the most common offense category, but the overall figures have held relatively stable. The Sheriff’s Department adjusts patrol routes and community outreach as localized spikes show up in the data.
Public Safety and Emergency Services
Temecula doesn’t run its own municipal police department. Instead, the city contracts directly with the Riverside County Sheriff’s Department for police services - a common arrangement in this part of Southern California, and one that gives the city access to a larger pool of specialized units and regional dispatch infrastructure.
Fire and emergency medical response come through Cal Fire and the Riverside County Fire Department. That regional integration matters in a county where brush fires are a real and recurring concern.
Police and Fire Coverage
The Sheriff’s Department handles patrol operations, traffic enforcement, and criminal investigations. The arrangement works because the county brings resources that a standalone city department might struggle to maintain on its own.
Cal Fire’s presence is particularly relevant here. Stations are positioned to cover both the commercial corridors and the more rural outskirts of the city, which is where wildfire exposure tends to be highest.
Where Local Substations Are Located
Deputies serving Temecula operate out of the Southwest Station, headquartered in neighboring Murrieta. Within city limits, the department maintains two storefront substations to keep a visible local presence: the Temecula Old Town Substation and the Temecula Promenade Mall Substation.
Exact sworn-staffing counts fluctuate, but one estimate puts the ratio at roughly one officer per 1,063 residents supporting the area.
Environmental and Natural Hazards
Safety in Southern California involves more than crime rates. If you’re coming from another region, the environmental hazard picture here may be less familiar territory, so understand it before you’re deep into escrow.
Water quality near recreational areas is monitored by state and county health departments, which issue advisories when conditions change seasonally.
Lake Skinner and Local Waterways
Lake Skinner sits just outside the city limits and is a popular spot for boating, fishing, and camping. Water conditions can shift based on temperature and algae blooms, so check the California Department of Public Health or local park notices before you go - and if you’re buying near a recreational water source, factor those seasonal changes into your planning.
Wildfires and Earthquake Fault Zones
Like most of Riverside County, Temecula sits in a region with real wildfire and earthquake exposure. Before making an offer, pull up Cal Fire’s hazard severity zone maps to see whether a specific property falls in an area that requires specialized insurance or brush clearance compliance.
Earthquakes are a standard part of any California purchase. During escrow, you’ll receive a Natural Hazard Disclosure (NHD) report that spells out whether the home sits within a mapped fault zone or an area susceptible to liquefaction. Read it carefully.
What Living in Temecula Is Like
The statistics only go so far. Day-to-day life here is shaped by a mix of suburban neighborhoods, commercial centers, and agricultural land - a combination that gives the city a feel that’s harder to quantify than a crime rate.
Right now there are about 330 homes available on the market. Inventory spans single-family houses to townhomes, and things are moving - over 110 homes have sold recently, with roughly 40% closing above list price.
Local Amenities and Recreation
Temecula Valley Wine Country is the headline amenity, and it earns the attention - dozens of wineries, year-round visitors, and a regional identity built around it. Old Town Temecula gives you a walkable district with historic architecture, restaurants, and retail that actually has some character.
For people who want to be outside, the city maintains parks, sports complexes, and miles of multi-use trails. It’s a genuinely well-kept system.
Commuting via I-15
The I-15 is your primary route if you’re commuting north toward Riverside and San Bernardino, or south toward San Diego. Traffic on that corridor during peak hours is something you’ll want to experience before you commit to a property - proximity to on-ramps matters more than most buyers initially think.
That said, the local economy has grown enough that more residents are working within the city itself, which takes some pressure off the freeway for daily commuters.
Frequently Asked Questions
What are the safest neighborhoods to buy a house in Temecula, CA?
Under Fair Housing guidelines, real estate professionals don’t rank neighborhoods by safety or steer buyers toward specific areas. What I can do is point you to the data: NeighborhoodScout puts the city’s overall crime rate at about 18 crimes per 1,000 residents. Review that alongside local police reports and make your own call.
How does the crime rate in Temecula compare to surrounding Southern California cities?
Temecula generally holds up well against state averages. The overall crime rate is higher than 64% of California’s cities and towns, but it remains close to or slightly below national crime averages - driven largely by low violent crime rates.
What types of property crimes are most common in Temecula residential areas?
Property crime makes up the majority of reported offenses. CrimeGrade reports a rate of roughly 15.86 per 1,000 residents, which typically covers theft, burglary, and vandalism.
Where can home buyers find accurate, up-to-date crime maps for specific Temecula zip codes?
CrimeGrade, NeighborhoodScout, and CrimeMapping.com all offer detailed mapping tools. The Riverside County Sheriff’s Department also provides public logs and resources for researching specific zip codes.
Is the Old Town Temecula area safe to walk around at night if we buy a property nearby?
Old Town is a popular, well-trafficked commercial and dining district. The Riverside County Sheriff’s Department maintains the Temecula Old Town Substation directly in that area, which keeps a visible law enforcement presence close by.
Are there high-risk wildfire or earthquake zones in Temecula that could impact home safety and insurance?
Yes. Like much of Southern California, parts of the city carry wildfire and earthquake exposure. You’ll receive a Natural Hazard Disclosure (NHD) report during the purchase process that details those risks. Check Cal Fire’s maps early - before you fall in love with a specific property - to understand whether specialized insurance or brush clearance requirements apply.